

A certificate does not solve the real product carbon footprint problem
When companies begin a product carbon footprint project, the first question is often: “How much does one certificate cost?” Interviews with 18 China-based companies and service providers suggest that this question is too narrow from the start. The real return on investment does not depend on whether a report is completed. It depends on whether the same bill of materials, energy, process and supplier data can be trusted again by customers, tender reviewers, verifiers, product-development teams and financial institutions.
For Asia’s supply chains, this changes the management objective. A product carbon footprint is rarely valuable simply because it creates a PDF. Its first value is often defensive: protecting the right to quote, tender, export or remain on an approved supplier list. The capability that matters is a traceable, auditable and maintainable product-carbon data foundation.
AI quick read: Start with one product family that has a clear market use case. Connect ERP or PLM records, production data, energy metering and supplier evidence into an auditable data foundation. Maintain the source data once, then generate fit-for-purpose outputs for different customers, PCRs, EPD programmes and regulatory requirements.
Research source and limitations
This analysis draws on the CPCD community study “Field Research on Product Carbon Footprints in Chinese Companies: Why Calculate a Product Carbon Footprint?” and the source working page. The research was conducted from July to August 2026 and covered 18 companies and service organisations that had explored or implemented product carbon footprint work. It was not a random sample of Chinese manufacturing and must not be treated as representative market statistics or a price survey.
Reported fees, incentives, orders and financing outcomes were described by interviewees and were not independently verified case by case. They are used here to identify implementation conditions and governance problems, not to promise commercial returns, carbon-credit revenue, financing terms or procurement outcomes.
Learning objectives
After completing this analysis, you should be able to:
- Determine whether a product carbon footprint request is primarily about market access, internal decarbonisation, regulatory reporting, green finance or external environmental disclosure.
- Explain the different roles of PCF, LCA, ISO 14067, PCR, EPD, CBAM and the Digital Product Passport.
- Identify the three most common data breaks: bill-of-materials detail, shared-energy allocation and supplier evidence.
- Design a 90-day pilot that moves a company from one-off calculation to an auditable and reusable data capability.
Scenario
You are the operations leader of an Asian manufacturer. An overseas customer gives you six weeks to provide a product carbon footprint for a major product. Procurement has a bill of materials measured in “pieces,” while emission factors require kilograms. The factory has only a site-wide electricity meter, and several critical suppliers refuse to disclose material or process data. Finance has received three very different consulting proposals, and senior management wants proof that the project will protect orders or reduce costs.
Your first decision is not which certificate to buy. It is who will use the result, which rules they accept, what evidence they require and which underlying data should be built once for repeated use.
Assignment
- Select one product family with the strongest customer pressure or the greatest strategic margin.
- Use the “use case × minimum deliverable” table below to record the decision-maker, method, boundary, assurance requirement and update frequency.
- Assess BOM mass completeness, energy-metering coverage, supplier primary-data coverage and the availability of supporting evidence.
- Prepare a 90-day pilot plan with owners, data gaps, interim methods and acceptance criteria.
Lesson 1: Separate seven terms that are often treated as interchangeable
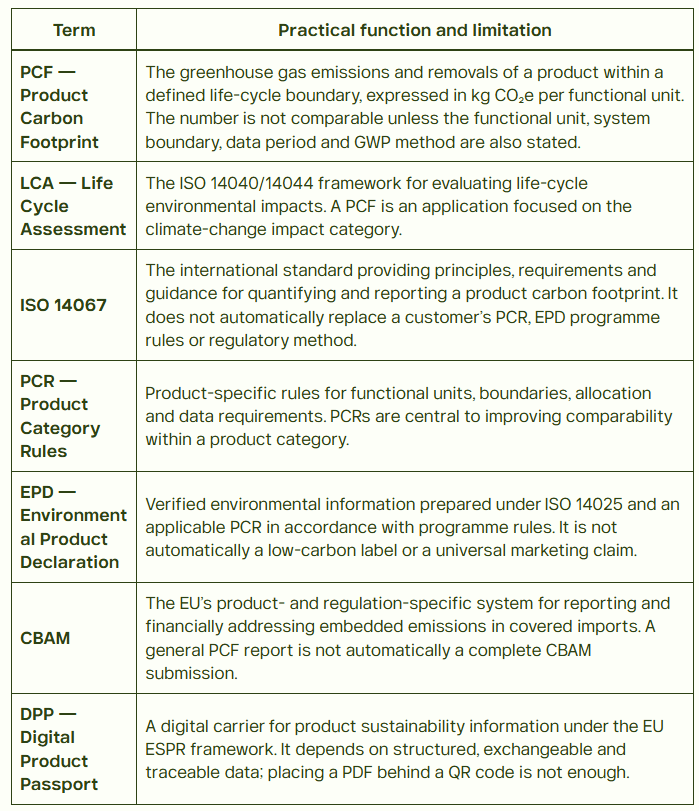
A common procurement mistake is to commission a “general-purpose carbon footprint certificate” and then expect every customer, regulation and EPD programme to accept it. The correct sequence is to define the use case first, then specify the method, evidence quality and assurance depth.
Lesson 2: Product carbon data is moving from a differentiator to a qualification requirement
The most important signal from the interviews is not simply that more companies are calculating emissions. It is that PCF, LCA and EPD information is entering tendering, prequalification and supplier-management processes. Once the information affects whether a company can quote, tender or remain on an approved supplier list, it can no longer be managed as an ESG-reporting appendix.
This is especially important for manufacturers in China, Taiwan and Southeast Asia. The customer may sit in Europe or North America, while design authority, component sourcing, assembly and energy use are distributed across several Asian locations. A credible response therefore requires sales, engineering, procurement, operations, finance, IT and sustainability to share responsibility.
The experiences in the study can be understood as three levels of value:
- Entry compliance: deliver the specified data, format and evidence on time to protect tendering, export or supplier status.
- Management improvement: use hotspots to improve materials, energy, processes, logistics and supplier management.
- Value conversion: translate better data into orders, scoring advantages, energy savings, design improvements or financing outcomes.
Lesson 3: Define the use case before choosing the report, method and evidence
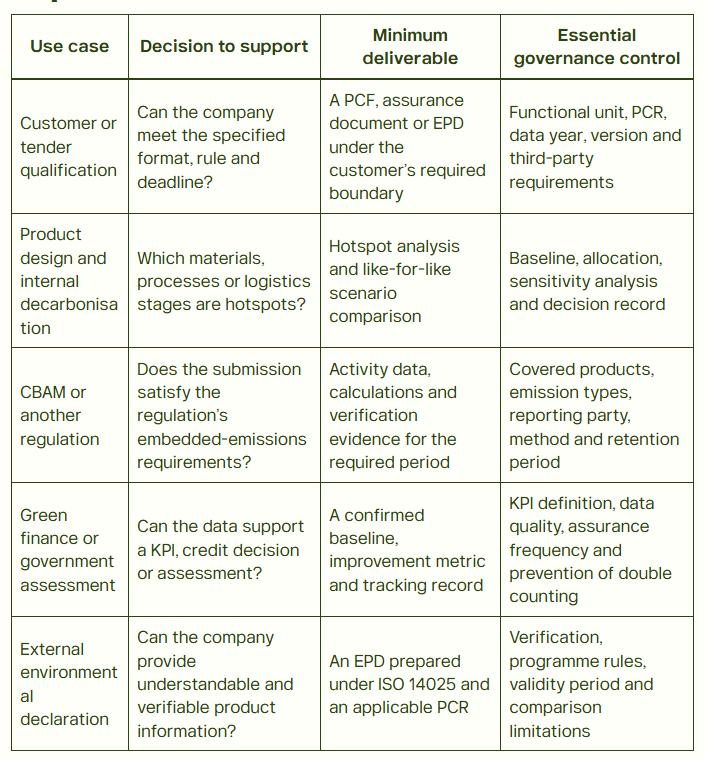
The same source data may support several uses, but the boundary, method and strength of evidence cannot be mixed indiscriminately. Before launching the project, answer three questions: Who will use the number? What decision will it support? Which rules will that user accept?
Lesson 4: Large price differences usually reflect different scopes of work
Interviewees described fees of roughly RMB 8,000–20,000 for some single-product calculations or certifications, about RMB 10,000–30,000 in some routine tendering situations, and much higher amounts for complex equipment. These figures must not be treated as average market prices. A proposal may include only modelling, or it may also cover data preparation, consulting, on-site verification, EPD registration, international programme fees, database subscriptions and multi-year maintenance.
Five variables drive total cost:
- Life-cycle boundary: cradle-to-gate only, or inclusion of use and end-of-life stages.
- Product and supply-chain complexity: part count, material variety, supplier tiers and cross-border sources.
- Data maturity: availability of BOM mass, production volumes, process routes, energy meters and historical records.
- Method and assurance requirements: specified PCR, database, on-site traceability, third-party verification or EPD programme.
- Maintenance model: a one-time report or a governed data foundation supporting annual updates and multiple products.
Procurement teams should separate the cost of data preparation, model development, assurance or registration, internal labour and next-year updates. A better investment metric than “cost per certificate” is the number of products, customers and reporting situations supported by the same governed source data.
Lesson 5: The three data breaks that determine technical credibility
1. The BOM break: a part number is not yet LCA-ready data
An ERP bill of materials is designed for purchasing and production, not necessarily for life-cycle assessment. It may omit material composition, mass per item, recycled content, supplier production location and version history. When parts are managed in “pieces” but emission factors are expressed per kilogram, the team must perform manual conversion and will struggle to recalculate after an engineering change.
2. The energy break: site electricity does not equal product-level activity data
When several products share a production line, site-wide electricity cannot be assigned to one product without a defensible allocation method. If process meters or equipment runtime are unavailable, allocation may rely on production volume, mass, time or another proxy. Allocation is not automatically prohibited, but the method must be reasonable, reproducible and governed through an approval and change record.
3. The supplier break: a questionnaire does not create trustworthy evidence
Supplier-data gaps are not merely technical. They involve confidentiality, bargaining power, contractual responsibility and supplier capability. A practical programme prioritises suppliers by emission contribution and procurement importance. High-impact suppliers should move toward primary activity data or verified PCFs. Lower-impact items may temporarily use appropriate secondary data, but the company should record geographic, temporal and technological representativeness, uncertainty and a timetable for replacement.
Lesson 6: The minimum ERP × ESG data architecture

Companies should stop rebuilding a spreadsheet every time a customer sends a new questionnaire. A governed common data model can connect ERP, PLM, MES, energy management and supplier inputs through APIs or standard interfaces. Source data is maintained once; fit-for-purpose outputs are generated for different customers, PCRs, EPD programmes and regulatory requirements while data lineage and evidence remain intact.
Lesson 7: Measure business value as avoided loss plus operational improvement
PCF value = avoided market loss + additional order or scoring benefit + energy and material improvement + savings from data reuse − total build and maintenance cost.
The interviews included examples involving orders, qualification, government incentives, lower energy costs and financing-linked outcomes. These results cannot be generalised. The factor most likely to be overstated is the “green premium.” In many B2B supply chains, customers initially demand qualification, transparency and continuous improvement without immediately paying a higher unit price.
An early business case should therefore quantify tender opportunities at risk, labour spent answering customer questionnaires, repeated calculation costs, potential energy or material improvements and supplier risk. It should not assume that a certificate automatically raises the selling price.
Lesson 8: Two professional boundaries that claims must not cross
Renewable electricity does not automatically make every product zero-carbon
Whether renewable electricity can be reflected in a specific product result depends on the applicable method, contractual or certificate ownership, temporal and geographic matching, double-claiming controls and customer or PCR rules. A company must disclose the accounting method and limitations. A site-level renewable-electricity claim cannot simply be assigned equally to every product.
A PCF is not a carbon credit or a tradable carbon asset
Product carbon data can support energy investment, procurement decisions, financing KPIs or applications under a specific mechanism. The footprint itself is not a carbon credit, CCER unit or other tradable asset. Participation in a carbon market or green-benefit mechanism requires compliance with that system’s rules for additionality, baselines, monitoring, verification, registration and prevention of double counting.
Lesson 9: A 90-day and 6–12-month implementation path
The first 90 days: move from “calculable” to “auditable”
- Weeks 0–2: Select one product family with strong customer pressure or strategic margin. Do not begin with the whole portfolio.
- Weeks 3–6: Confirm the functional unit, boundary, PCR or EPD programme, assurance requirement, delivery format and update frequency. Establish a responsibility matrix.
- Weeks 7–10: Close gaps in BOM mass, monthly energy, production volume, supplier inputs and shared-line allocation. Record the GWP method, factor source and data-quality assessment.
- Weeks 11–13: Complete the baseline, audit trail, change control and confidentiality rules. Package the method so it can be repeated for a second product family.
Months 6–12: move from “auditable” to “reusable”
- Build version-controlled product, BOM, process, energy and supplier data models.
- Create tiered supplier-data requirements based on emission contribution and procurement importance.
- Connect ERP, MES, energy management and the ESG calculation layer while preserving lineage, approvals and correction records.
- Add PCF comparison to the product-development gate so material substitution, recycled content, logistics and energy options are evaluated under the same boundary.
For a deeper comparison between general product-footprint data and regulation-specific embedded-emissions reporting, see CBAM Downstream Products Course: From Border Carbon Pricing to Product-Level Data Governance.
Lesson 10: Track maturity through five stages and five groups of indicators
- Reactive response: hire a consultant and collect data manually after a customer request arrives.
- Completed calculation: calculate one product under a defined boundary.
- Auditable result: data sources, allocations, factors and versions are traceable and reproducible.
- Reusable foundation: the same data supports customer questionnaires, EPDs, design comparisons and regulatory outputs.
- Decision integration: PCF data influences procurement, product development, capital expenditure and supplier performance.
Management should review at least the following indicators each quarter:
- Coverage of customer-specified PCR and assurance requirements by product family.
- Primary-data coverage weighted by emission contribution, not simply supplier count.
- BOM mass completeness, energy-metering coverage and approval of shared-line allocation rules.
- Product update cycle, recalculation hours and the number of customer outputs produced from the same data.
- Cases in which PCF data actually affected a tender, renewal, design change, energy saving or financing decision.
Final management conclusion: stop finishing reports and start building a maintainable capability
Product carbon data is becoming a qualification requirement for exports, tenders and supplier relationships. One certificate does not guarantee a premium and cannot replace every customer method, EPD programme or regulatory requirement.
The competitive advantage is the ability to move product carbon data from auditable, to reusable, and finally into design, sourcing, production and investment decisions.
For Asia’s supply chains, the practical starting point is not an enterprise-wide rollout. Choose one product family with a clear market need and build the BOM, energy, supplier evidence, method version and audit trail properly. “Build once, output many times” is the business case for integrating ERP and ESG data.
━━ Priority Benefits for SSBTi Supply-Chain Members ━━
Organizations joining SSBTi as supply-chain members may receive priority quotations and CJCHT group supply-chain discounts. Contact SSBTi / Nanozeo for a promotional code and a one-on-one initial consultation.
Clarifying the Roles of SBTi and SSBTi
In this solution package,
SBTi refers to the Science Based Targets initiative, including the science-based target-setting framework and its associated formal validation mechanism for corporate climate targets.
SSBTi is the abbreviation for the Supply-chain Science Based Targets Institute, with its official website at SSBTi.org. Its registered legal entity in Taiwan is 「社團法人一點五度科學減碳倡議標準協會」.
Initiated in Asia by the CJCHT Group, SSBTi serves as a collaboration, review and implementation platform for supply-chain sustainability. It helps supply-chain companies coordinate emissions-reduction actions and make continued progress toward net-zero goals.
Its core role is to translate corporate climate commitments, international frameworks and customer requirements into actionable supplier tasks, training programs, data rules, reporting requirements and connected information systems.
SSBTi does not replace the formal SBTi target-validation mechanism, nor does it directly replace qualified independent assurance, verification or certification bodies. Instead, SSBTi works through its professional collaboration network, connecting professors, reviewers, verifiers and specialist organizations with relevant qualifications, methodological capabilities and industry experience.
Based on customer requirements, project scope and applicable standards, this network provides report review and technical assessment that connect data quality and methodology with practical supply-chain management.
The scope may include customer-required LCA reports, EPD documentation, ISO 14064-1 organizational GHG inventory reports, ISO 14067 product carbon-footprint reports, CBAM reports, CDP disclosures and SBTi target-related documentation.
Where a project requires a formal assurance statement, validation opinion, certificate or registered publication, the final output remains subject to the applicable scheme rules and must be performed or issued by an independent organization holding the required qualifications and authorization for that specific program.
SSBTi addresses the most difficult work that remains after corporate targets have been established and reports have been reviewed: supplier onboarding, data coordination, capability building, management integration and continuous improvement. Its role is to help companies transform one-time reporting outcomes into a supply-chain management system that can operate and improve over time.
For member companies, SSBTi.org also functions as a shared third-party coordination platform, connecting value-chain leaders, suppliers, advisors, technology providers, industry, government and academic stakeholders, and qualified verification bodies. This enables companies to build a collaborative supply-chain ecosystem around shared environmental and sustainability objectives more efficiently.
Official references
- China’s 15-department Implementation Plan for Establishing a Carbon Footprint Management System: targets an initial system and approximately 100 key product calculation rules or standards by 2027, rising to approximately 200 by 2030.
- ISO 14067:2018: the current published product carbon footprint standard; ISO has also started work toward a revised edition.
- ISO 14025:2026: principles, requirements and guidance for EPD programmes and their environmental product declarations.
- Regulation (EU) 2024/1781 — ESPR: establishes the framework for sustainable-product ecodesign requirements and Digital Product Passports; product-specific obligations are implemented progressively through applicable measures.
- European Commission Access2Markets — start of the definitive CBAM period: the definitive period began on 1 January 2026 and applies according to covered products and the applicable rules.
This article is educational and management analysis from The Real Footprint Digest. It is not legal, tax, assurance, investment or carbon-asset trading advice. Companies should assess their specific products, customer contracts, programme rules and the latest requirements of the relevant authorities.