SSBTi 榮獲中國半官方產品碳足跡平台-CPCD範疇三的示範案例 SSBTi won the demonstration case of China's semi-official product carbon footprint platform-CPCD Category 3
- Newsroom

- Jul 25, 2025
- 17 min read
SSBTi (供應鏈科學減碳目標倡議聯盟)宣布榮獲中國半官方產品碳足跡平台-CPCD 作為範疇三案例。SSBTi並且發布供應鏈碳排放核算的6大誤區及解決方案,以專業解析幫助公司企業規避風險。
SSBTi( Supply-chain council for SBTi ) announced that it has won the China Semi-official Product Carbon Footprint Platform-CPCD as a Category 3 case. SSBTi also released the 6 Major Pitfalls in Supply Chain Carbon Accounting: Expert Analysis to Help You Mitigate Risks!
SSBTi表示,供應鏈碳排放計算(即範疇三排放)是企業碳管理中最複雜且最具挑戰性的部分。許多企業在計算過程中容易陷入誤區,導致數據偏差、決策失誤甚至合規風險。那麼,企業在計算供應鏈碳排放時,究竟有哪些常見誤區?又該如何避免這些問題呢?
SSBTi said,Supply chain carbon emissions calculation (i.e., Scope 3 emissions) is the most complex and challenging part of corporate carbon management. Many companies are prone to fall into pitfalls during the calculation process, leading to data deviations, decision-making errors, and even compliance risks. So, what are the common pitfalls for companies when calculating supply chain carbon emissions? And how can these problems be avoided?
這項服務將結合在Nanozeo(一家專注於綠色技術和可持續性的公司,隸屬於CJCHT集團。該集團曾被沃爾瑪評為最佳供應商)和SSBTi(“Supply-chain council for Science-Based Targets initiatives & standards”,是一個非營利組織,專注於幫助供應鏈企業處理碳披露和設定科學基礎的目標(SBTi標準))的實戰經驗出發,剖析常見問題並提供解決方案,幫助企業提升供應鏈碳排放核算的準確性和可靠性。
Drawing from our practical experience at Nanozeo (a company focused on green technology and sustainability, part of the CJCHT Group, which was once named the best supplier by Walmart) and SSBTi ("Supply-chain council for Science-Based Targets initiatives & standards," a non-profit organization dedicated to helping supply chain companies handle carbon disclosure and set Science-Based Targets (SBTi standards)), we will analyze common problems and provide solutions to help companies improve the accuracy and reliability of their supply chain carbon emissions accounting.
如有進一步需求,SSBTi 推薦使用eFootprint和CLCD+ecoinvent數據庫,這些工具目前由NANOZEO代理,歡迎點擊下方連結了解詳情或洽詢。
If you have further needs, SSBTi recommends using the eFootprint and CLCD+ecoinvent databases. These tools are currently represented by NANOZEO. Please click the links below for details or inquiries.
供應鏈碳排放計算的常見問題與解決方案(中英雙語)
Common Issues and Solutions for Supply Chain Carbon Emission Calculation (Bilingual)
供應鏈碳排放核算的6大誤區,專業解析助你規避風險!
The 6 Major Pitfalls in Supply Chain Carbon Accounting: Expert Analysis to Help You Mitigate Risks!
問題 Questions::
供應鏈碳排放計算(即範疇三排放)是企業碳管理中最複雜且最具挑戰性的部分。許多企業在計算過程中容易陷入誤區,導致數據偏差、決策失誤甚至合規風險。那麼,企業在計算供應鏈碳排放時,究竟有哪些常見誤區?又該如何避免這些問題呢?
Supply chain carbon emissions calculation (i.e., Scope 3 emissions) is the most complex and challenging part of corporate carbon management. Many companies are prone to fall into pitfalls during the calculation process, leading to data deviations, decision-making errors, and even compliance risks. So, what are the common pitfalls for companies when calculating supply chain carbon emissions? And how can these problems be avoided?
解答 Solutions:
我們將結合在Nanozeo(一家專注於綠色技術和可持續性的公司,隸屬於CJCHT集團。該集團曾被沃爾瑪評為最佳供應商)和SSBTi(“Supply-chain council for Science-Based Targets initiatives & standards”,是一個非營利組織,專注於幫助供應鏈企業處理碳披露和設定科學基礎的目標(SBTi標準))的實戰經驗出發,剖析常見問題並提供解決方案,幫助企業提升供應鏈碳排放核算的準確性和可靠性。
Drawing from our practical experience at Nanozeo (a company focused on green technology and sustainability, part of the CJCHT Group, which was once named the best supplier by Walmart) and SSBTi ("Supply-chain council for Science-Based Targets initiatives & standards," a non-profit organization dedicated to helping supply chain companies handle carbon disclosure and set Science-Based Targets (SBTi standards)), we will analyze common problems and provide solutions to help companies improve the accuracy and reliability of their supply chain carbon emissions accounting.
誤區1:只計算直接供應商(Tier 1),忽略更上游的碳排放
I. Pitfall 1: Only Calculating Direct Suppliers (Tier 1) and Ignoring Further Upstream Carbon Emissions
根據GHG PROTOCOL Scope3核算標準(以下簡稱“標準”),”Category 2:上游購買的資本物品產生的排放過程”等效於“基於ISO 14064-1: 2018標準,類別4:源自組織使用的產品的間接GHG排放(對應子類別4.2源自資本貨物的排放)”,也可參考BS ISO 14068-1:2023的相關內容。因此,企業可以參考ISO 14064-1的方法和要求進行碳足跡核算。
→ 問題:90%的供應鏈碳排放或許被忽視!
誤區:企業往往只向直接供應商(Tier 1)索取碳排放數據,卻忽略更上游的 Tier 2、Tier 3 供應商。
後果:這會導致碳足跡嚴重低估,特別是涉及原材料、半成品、電子元件等行業。例如,根據《2024年CDP供應鏈報告》(Supply Chain Report 2024: Strengthening the Chain),範疇三排放通常佔企業總排放的70%以上,其中上游供應鏈貢獻尤為顯著。
實戰建議:
分階段收集數據:優先從Tier 1供應商獲取數據,逐步向上游追溯,建立供應鏈碳排放全景圖。
借助行業數據庫:對於暫無數據的供應商,可參考行業數據庫(如ecoinvent、CPCD、CLCD、ELCD)填補數據空白。例如,ecoinvent數據庫提供超過22000種產品的生命週期排放數據,可作為補充工具。
案例參考:電子製造企業碳排放集中在原材料和零部件生產環節(Tier 2和Tier 3),其電子元件供應鏈的碳排放佔比高達45%(甚至高達80%-90%),從而調整了採購策略。
According to the GHG PROTOCOL Scope 3 calculation standard (hereinafter referred to as "the Standard"), "Category 2: Emissions from upstream purchased capital goods" is equivalent to "based on ISO 14064-1: 2018 standard, Category 4: Indirect GHG emissions from products used by the organization (corresponding to sub-category 4.2 emissions from capital goods)." Relevant content from BS ISO 14068-1:2023 can also be referenced. Therefore, companies can refer to the methods and requirements of ISO 14064-1 for carbon footprint accounting.
→ Problem: 90% of supply chain carbon emissions might be ignored!
Pitfall: Companies often only request carbon emission data from direct suppliers (Tier 1), while overlooking upstream Tier 2 and Tier 3 suppliers.
Consequence: This leads to a severe underestimation of the carbon footprint, especially in industries involving raw materials, semi-finished products, and electronic components. For instance, according to the "2024 CDP Supply Chain Report: Strengthening the Chain," Scope 3 emissions typically account for over 70% of a company's total emissions, with the upstream supply chain being a particularly significant contributor.
Practical Advice:
Collect data in stages: Prioritize obtaining data from Tier 1 suppliers and gradually trace it upstream to create a comprehensive overview of supply chain carbon emissions.
Utilize industry databases: For suppliers with no available data, refer to industry databases (such as ecoinvent, CPCD, CLCD, ELCD) to fill data gaps. For example, the ecoinvent database provides life cycle emission data for over 22,000 products and can be used as a supplementary tool.
Case Reference: An electronics manufacturing company found that its carbon emissions were concentrated in the raw material and component production stages (Tier 2 and Tier 3), with its electronic component supply chain accounting for as high as 45% (or even up to 80%-90%) of emissions, leading to an adjustment in its procurement strategy.
誤區2:過度依賴行業數據,忽略企業自身特性
II. Pitfall 2: Over-reliance on Industry Data, Ignoring Company-Specific Characteristics
→ 問題:你的供應鏈排放可能比行業均值高出50%-100%!
誤區:許多企業直接套用行業平均碳排放係數,而不考慮自身供應鏈的特定條件(如供應商的生產工藝、能源結構等)。
後果:如果供應商的生產方式更清潔或更高碳,行業數據就會嚴重失真,影響企業的減排決策。
實戰建議:
校準數據:要求主要供應商提供實際能耗和排放數據,用於校準行業平均值。例如,可要求供應商提供電力消耗數據,並結合當地電網排放因子計算實際排放。
採用混合LCA(Hybrid LCA)方法:結合企業實際數據與行業數據,提升核算精度。
案例參考:時尚、紡織和服裝行業的碳排放差異較大,尤其是能源結構不同的供應商之間。若透過校準數據,使用可再生能源的供應商碳排放可比行業平均值低20%-45%。
→ Problem: Your supply chain emissions could be 50%-100% higher than the industry average!
Pitfall: Many companies directly apply average industry carbon emission factors without considering their own supply chain's specific conditions (such as a supplier's production processes, energy mix, etc.).
Consequence: If a supplier's production methods are cleaner or more carbon-intensive, the industry data will be severely distorted, affecting the company's emission reduction decisions.
Practical Advice:
Calibrate data: Request actual energy consumption and emissions data from major suppliers to calibrate industry averages. For example, you can ask suppliers for electricity consumption data and calculate actual emissions using the local grid's emission factor.
Adopt a Hybrid LCA (Life Cycle Assessment) method: Combine the company's actual data with industry data to improve accounting accuracy.
Case Reference: Carbon emissions in the fashion, textile, and apparel industries vary significantly, especially among suppliers with different energy structures. By calibrating data, suppliers using renewable energy can have carbon emissions 20%-45% lower than the industry average.
誤區3:沒有區分「地區因素」,碳排放數據不準
III. Pitfall 3: Failing to Differentiate "Regional Factors," Leading to Inaccurate Carbon Emission Data
→ 問題:地區差異可能讓你的碳排放數據誤差高達300%!
誤區:很多企業假設全球供應商的排放係數相同。例如,認為中國和歐洲的鋼材生產排放強度相同。
後果:這導致碳足跡計算結果嚴重錯誤,特別是電力密集型行業(如電子產品、金屬加工)。根據《關於發布2022年電力二氧化碳排放因子的公告》,2022年中國電網的碳排放因子約為 0.5366 kg CO_2/kWh;而歐盟平均僅為 0.251 kg CO_2/kWh,相差超過一倍;此外,某些國家間的電力排放強度甚至相差300%以上。
實戰建議:
使用區域性排放因子:根據供應商所在地區的能源結構,採用當地的電網排放因子或其他區域性數據。
借助全球數據庫:利用ecoinvent、GEMIS等數據庫調整數據,確保核算結果反映區域差異。
案例參考:某汽車零部件企業透過引入區域性排放因子,發現其中國供應商的碳排放強度是歐洲供應商的2.5倍,需要優化全球採購佈局。
→ Problem: Regional differences could cause your carbon emission data to have an error margin of up to 300%!
Pitfall: Many companies assume that emission factors are the same for all global suppliers. For example, assuming that steel production in China and Europe has the same emission intensity.
Consequence: This leads to significant errors in carbon footprint calculations, especially for electricity-intensive industries (like electronics, metal processing). According to the "Announcement on the Release of 2022 Power Grid Carbon Dioxide Emission Factors," the carbon emission factor for China's power grid in 2022 was approximately 0.5366 kg CO_2/kWh, while the EU average was only 0.251 kg CO_2/kWh, a difference of more than double. Furthermore, the electricity emission intensity between some countries can differ by more than 300%.
Practical Advice:
Use regional emission factors: Adopt local grid emission factors or other regional data based on the energy mix of the supplier's location.
Leverage global databases: Use databases like ecoinvent and GEMIS to adjust data, ensuring the calculation results reflect regional differences.
Case Reference: An automotive parts company introduced regional emission factors and found that the carbon emission intensity of its Chinese suppliers was 2.5 times that of its European suppliers, necessitating an optimization of its global procurement layout.
誤區4:低估運輸碳排放,只考慮生產碳足跡
IV. Pitfall 4: Underestimating Transportation Emissions and Only Considering the Production Carbon Footprint
→ 問題:運輸排放可能佔供應鏈碳足跡的30%-50%,你卻視而不見!
誤區:企業往往只計算產品生產過程的碳排放,忽略了運輸(特別是空運、海運)的碳排放。
後果:物流碳排放在某些行業可能佔總碳足跡的 30%-50%,如果不計算,排放報告會嚴重失真。尤其在全球化企業中更為顯著。例如,根據《2022年國際海事組織報告》,海運每噸貨物每公里的CO_2排放因子約為 0.016 kg,而空運約為 0.54 kg,相差30倍。
實戰建議
計算全生命週期碳足跡:在核算中納入運輸、倉儲、配送等環節的碳排放。
優化物流策略:對比不同運輸方式的排放強度(如海運 vs 空運 vs 陸運),優先選擇低碳運輸方式。例如,某消費品企業透過將空運轉為海運,物流碳排放降低了65%。
工具支持:採用物流碳排放計算軟體(如EcoTransIT World),快速估算不同運輸方式的排放量。
→ Problem: Transportation emissions might account for 30%-50% of the supply chain carbon footprint, yet you ignore it!
Pitfall: Companies often only calculate the carbon emissions from the product manufacturing process, neglecting emissions from transportation (especially air and sea freight).
Consequence: In some industries, logistics carbon emissions can account for 30%-50% of the total carbon footprint. If not calculated, the emissions report will be severely distorted. This is particularly significant for globalized companies. For example, according to the "2022 International Maritime Organization Report," the CO_2 emission factor for sea freight is about 0.016 kg per ton-kilometer, while for air freight, it is about 0.54 kg—a 30-fold difference.
Practical Advice:
Calculate the full life-cycle carbon footprint: Include carbon emissions from transportation, warehousing, and distribution in your accounting.
Optimize logistics strategies: Compare the emission intensities of different transport modes (e.g., sea vs. air vs. land) and prioritize low-carbon options. For instance, a consumer goods company reduced its logistics carbon emissions by 65% by switching from air to sea freight.
Tool Support: Use logistics carbon emission calculation software (like EcoTransIT World) to quickly estimate the emissions of different transport modes.
誤區5:忽略供應商的「雙重計算問題」,導致排放數據重疊
V. Pitfall 5: Ignoring the "Double Counting Problem" with Suppliers, Leading to Overlapping Emission Data
→ 問題:重複計算可能讓你的碳排放數據虛高20%-30%!
誤區:供應商往往只提供自己的碳足跡報告,但不同供應商之間提供的碳足跡報告可能存在重複計算。例如,原材料和成品供應商都計算了同一批材料的碳排放。
後果:這會導致企業總排放數據被誇大,影響企業碳減排目標的設定和執行。
實戰建議:
明確邊界條件:要求供應商在報告中明確其排放邊界的定義,避免同一排放源被重複計算。
標準化數據收集:採用PCAF(Partnership for Carbon Accounting Financials)方法,確保供應商數據的可比性和一致性。
案例參考:某零售企業透過與供應商聯合核查,發現其原材料和半成品環節存在10%-20%的重複計算;某知名品牌因重複計算,導致報告中的碳排放數據被放大20%以上,引發合規問題。
→ Problem: Double counting could inflate your carbon emission data by 20%-30%!
Pitfall: Suppliers often provide only their own carbon footprint reports, but reports from different suppliers may involve double counting. For example, both the raw material supplier and the finished product supplier calculate the carbon emissions for the same batch of materials.
Consequence: This leads to an overstatement of the company's total emission data, affecting the setting and execution of corporate carbon reduction targets.
Practical Advice:
Clarify boundary conditions: Require suppliers to clearly define their emission boundaries in their reports to avoid the same emission source being counted twice.
Standardize data collection: Adopt the PCAF (Partnership for Carbon Accounting Financials) methodology to ensure the comparability and consistency of supplier data.
Case Reference: Through joint verification with suppliers, a retail company discovered 10%-20% double counting in its raw material and semi-finished product stages. A well-known brand's reported carbon emissions were inflated by over 20% due to double counting, leading to compliance issues.
誤區6:碳排放數據沒有經過獨立驗證
VI. Pitfall 6: Carbon Emission Data Has Not Been Independently Verified
→ 問題:未經驗證的數據可能導致10%的「漂綠」風險!
誤區:許多企業僅依賴供應商提供的未經驗證的數據,缺乏獨立第三方審核。
後果:數據可能存在誤差或「漂綠」風險,無法滿足日益嚴格的合規要求(如歐盟CBAM、SBTi)。
實戰建議:
引入第三方審核:選擇具備LCA(生命週期評估)經驗的第三方機構(如SSBTi、Nanozeo)進行數據驗證,確保數據真實性和可信度。
遵循國際標準:參考《ISO 14064/14067》和《GHG Protocol》標準,確保核算流程和數據符合國際規範。
案例參考:某跨國零售企業透過引入第三方審核,發現其供應商數據中有10%的「漂綠」行為,調整後不僅滿足了合規要求,還提升了供應鏈透明度。
→ Problem: Unverified data could lead to a 10% "greenwashing" risk!
Pitfall: Many companies rely solely on unverified data provided by suppliers, lacking independent third-party auditing.
Consequence: The data may contain errors or pose a "greenwashing" risk, failing to meet increasingly stringent compliance requirements (such as the EU's CBAM, SBTi).
Practical Advice:
Introduce third-party auditing: Select a third-party organization with LCA (Life Cycle Assessment) experience (like SSBTi, Nanozeo) to verify the data, ensuring its authenticity and credibility.
Follow international standards: Refer to ISO 14064/14067 and the GHG Protocol standards to ensure the accounting process and data comply with international norms.
Case Reference: A multinational retail company, by introducing a third-party audit, identified "greenwashing" practices in 10% of its supplier data. After making adjustments, it not only met compliance requirements but also enhanced its supply chain transparency.
企業行動
Corporate Action
供應鏈碳排放核算中的錯誤,可能讓你的企業付出高昂代價——從合規罰款到ESG評級下滑,甚至失去市場信任!為此,企業可以採取以下措施:
精準數據收集:全面掌握供應鏈各環節的碳排放數據,避免遺漏或低估。
採用區域排放因子:根據供應商所在地的能源結構,確保核算結果真實反映區域差異。
引入第三方審計:透過獨立驗證,確保數據的準確性和可信度,滿足合規要求。
優化運輸策略:選擇低碳運輸方式,顯著降低物流環節的碳排放。
這些舉措不僅能幫助你規避合規風險,還能提升供應鏈透明度,提升企業競爭力,贏得投資者和市場的信任。現在就開始行動,優化你的供應鏈碳管理,為企業的可持續發展奠定堅實基礎!
Errors in supply chain carbon accounting can cost your company dearly—from compliance fines and lower ESG ratings to a loss of market trust! To this end, companies can take the following actions:
Precise data collection: Comprehensively grasp carbon emissions data from all links in the supply chain to avoid omissions or underestimations.
Adopt regional emission factors: Ensure that calculation results truly reflect regional differences by using factors based on the energy mix of the supplier's location.
Introduce third-party audits: Ensure data accuracy and credibility and meet compliance requirements through independent verification.
Optimize transport strategies: Choose low-carbon transportation methods to significantly reduce carbon emissions in the logistics chain.
These measures can not only help you avoid compliance risks but also increase supply chain transparency, enhance corporate competitiveness, and win the trust of investors and the market. Start acting now to optimize your supply chain carbon management and lay a solid foundation for your company's sustainable development!
點評 Comments
Scope 3排放是溫室氣體排放量核算過程中最為複雜的一環,涉及的種類繁多,且很多排放源面臨著「是否納入、如何計算、如何分配」。本文作者具有較豐富的實戰經驗,能夠從企業實際出發,分析問題並提出解決方案,文章總體的質量較高,能夠為企業提供較實際的幫助。隨著全球供應鏈碳排放管理要求的不斷細化,將會有越來越多的企業面臨著Scope 3的核算問題,需要深入討論的問題點還有很多,歡迎廣大讀者分享實戰經驗,與我們持續交流。
Scope 3 emissions are the most complex part of the greenhouse gas emissions accounting process, involving numerous categories, with many emission sources facing the questions of "whether to include, how to calculate, and how to allocate." The author of this article has extensive practical experience and is able to analyze problems and propose solutions from a corporate perspective. The overall quality of the article is high and can provide practical assistance to businesses. As global supply chain carbon emission management requirements become more detailed, more and more companies will face Scope 3 accounting issues. There are still many points that require in-depth discussion, and we welcome readers to share their practical experiences and continue to exchange ideas with us.
本文作者 Authors
解答:Raymond Wang(Nanozeo.com總經理)
審核:寧志遠(NSF International 上海禾邦認證有限公司)
點評:CPCD平台
Solution by: Raymond Wang (General Manager of Nanozeo.com)
Reviewed by: Ning Zhiyuan (NSF International Shanghai Hebang Certification Co., Ltd.)
Comments by: CPCD Platform
精彩回覆 Hot Reply
Q:小編,想問一下,在估算範圍三類別9下游運輸和分銷排放時,需計算倉儲和零售的排放,僅知產品重量,有沒有適合的零售排放因子推薦呢?
Q:Editor, I'd like to ask, when estimating Scope 3 Category 9 downstream transportation and distribution emissions, it's necessary to calculate emissions from warehousing and retail. If I only know the product weight, are there any recommended emission factors for retail?
A:Scope3供應鏈碳排放計算很重要,避免誤區數據會更準確。
A:Scope 3 supply chain carbon emission calculation is very important; avoiding pitfalls will make the data more accurate.

供應鏈碳排放計算的常見問題與解決方案(中英文雙語)
Common Issues and Solutions for Supply Chain Carbon Emission Calculation (Bilingual)
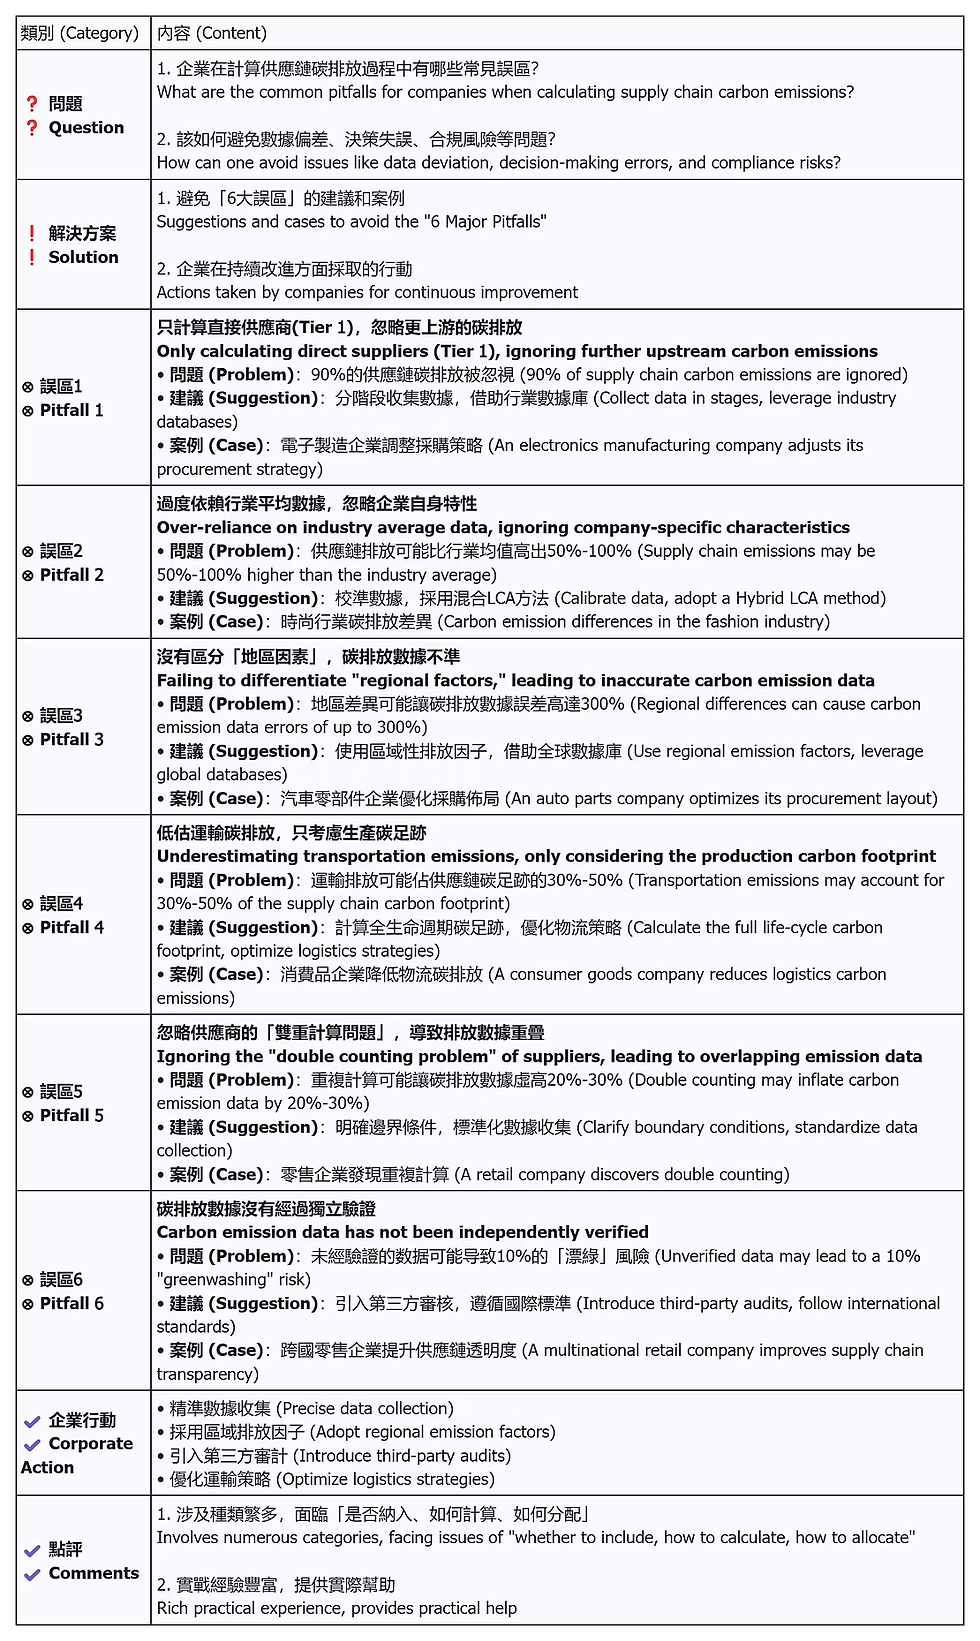
供應鏈碳排放計算的常見問題與解決方案 | |
類別 (Category) | 內容 (Content) |
❓ 問題 ❓ Question | 1. 企業在計算供應鏈碳排放過程中有哪些常見誤區? What are the common pitfalls for companies when calculating supply chain carbon emissions? 2. 該如何避免數據偏差、決策失誤、合規風險等問題? How can one avoid issues like data deviation, decision-making errors, and compliance risks? |
❗ 解決方案 ❗ Solution | 1. 避免「6大誤區」的建議和案例 Suggestions and cases to avoid the "6 Major Pitfalls" 2. 企業在持續改進方面採取的行動 Actions taken by companies for continuous improvement |
⊗ 誤區1 ⊗ Pitfall 1 | 只計算直接供應商(Tier 1),忽略更上游的碳排放 Only calculating direct suppliers (Tier 1), ignoring further upstream carbon emissions • 問題 (Problem):90%的供應鏈碳排放被忽視 (90% of supply chain carbon emissions are ignored) • 建議 (Suggestion):分階段收集數據,借助行業數據庫 (Collect data in stages, leverage industry databases) • 案例 (Case):電子製造企業調整採購策略 (An electronics manufacturing company adjusts its procurement strategy) |
⊗ 誤區2 ⊗ Pitfall 2 | 過度依賴行業平均數據,忽略企業自身特性 Over-reliance on industry average data, ignoring company-specific characteristics • 問題 (Problem):供應鏈排放可能比行業均值高出50%-100% (Supply chain emissions may be 50%-100% higher than the industry average) • 建議 (Suggestion):校準數據,採用混合LCA方法 (Calibrate data, adopt a Hybrid LCA method) • 案例 (Case):時尚行業碳排放差異 (Carbon emission differences in the fashion industry) |
⊗ 誤區3 ⊗ Pitfall 3 | 沒有區分「地區因素」,碳排放數據不準 Failing to differentiate "regional factors," leading to inaccurate carbon emission data • 問題 (Problem):地區差異可能讓碳排放數據誤差高達300% (Regional differences can cause carbon emission data errors of up to 300%) • 建議 (Suggestion):使用區域性排放因子,借助全球數據庫 (Use regional emission factors, leverage global databases) • 案例 (Case):汽車零部件企業優化採購佈局 (An auto parts company optimizes its procurement layout) |
⊗ 誤區4 ⊗ Pitfall 4 | 低估運輸碳排放,只考慮生產碳足跡 Underestimating transportation emissions, only considering the production carbon footprint • 問題 (Problem):運輸排放可能佔供應鏈碳足跡的30%-50% (Transportation emissions may account for 30%-50% of the supply chain carbon footprint) • 建議 (Suggestion):計算全生命週期碳足跡,優化物流策略 (Calculate the full life-cycle carbon footprint, optimize logistics strategies) • 案例 (Case):消費品企業降低物流碳排放 (A consumer goods company reduces logistics carbon emissions) |
⊗ 誤區5 ⊗ Pitfall 5 | 忽略供應商的「雙重計算問題」,導致排放數據重疊 Ignoring the "double counting problem" of suppliers, leading to overlapping emission data • 問題 (Problem):重複計算可能讓碳排放數據虛高20%-30% (Double counting may inflate carbon emission data by 20%-30%) • 建議 (Suggestion):明確邊界條件,標準化數據收集 (Clarify boundary conditions, standardize data collection) • 案例 (Case):零售企業發現重複計算 (A retail company discovers double counting) |
⊗ 誤區6 ⊗ Pitfall 6 | 碳排放數據沒有經過獨立驗證 Carbon emission data has not been independently verified • 問題 (Problem):未經驗證的数据可能导致10%的「漂綠」風險 (Unverified data may lead to a 10% "greenwashing" risk) • 建議 (Suggestion):引入第三方審核,遵循國際標準 (Introduce third-party audits, follow international standards) • 案例 (Case):跨國零售企業提升供應鏈透明度 (A multinational retail company improves supply chain transparency) |
✔ 企業行動 ✔ Corporate Action | • 精準數據收集 (Precise data collection) • 採用區域排放因子 (Adopt regional emission factors) • 引入第三方審計 (Introduce third-party audits) • 優化運輸策略 (Optimize logistics strategies) |
✔ 點評 ✔ Comments | 1. 涉及種類繁多,面臨「是否納入、如何計算、如何分配」 Involves numerous categories, facing issues of "whether to include, how to calculate, how to allocate" 2. 實戰經驗豐富,提供實際幫助 Rich practical experience, provides practical help |
★如有進一步需求,SSBTi 推薦使用eFootprint和CLCD+ecoinvent數據庫,目前由NANOZEO代理,歡迎點擊下方連結瞭解詳情或聯繫洽詢。
★If you have further needs, SSBTi recommends using the eFootprint and CLCD+ecoinvent databases. These tools are currently represented by NANOZEO. Please click the links below for details or inquiries.
Taiwan Area(台灣)
NANOZEO Inc. / Hsinchu Office
11F-5, No.65, Gaotie 7th Rd., Zhubei City, Hsinchu County 30273, Taiwan, R.O.C.
Tel: +886-3-658-9912 for Grace / Ali
Fax: +886-3-658-9242
E-mail:
China Area(中國)
NANOZEO Inc. / Shanghai Office
7F, Kunyang Bldg., No.798, Zhao Jia Bang Rd., Xu Hui District, Shanghai 200030, China
Tel: +86-21-6467-0653 Sales Department for Pelin / Jennifer
Pelin Mobile: +86-137-3828-7571
E-mail:


Comments